
A company can make every department faster and still leave the customer waiting. Support drafts a better reply. Finance checks an invoice more quickly. Operations summarizes the service history. The case continues to move through the same queues, with people reconstructing its context at each boundary.
This is why L3 deserves particular attention. In The six levels of an AI-native organization, I described L3 as organizational infrastructure: shared evidence, reusable workflows and explicit authority let AI carry work across systems and functions. The economic opportunity is to remove repeated coordination from a complete business process.
My thesis is that sufficiently reliable, connected automation can change which organizational arrangements are worth maintaining. Once routine work travels across functional boundaries within delegated authority, companies can organize more work around outcomes, with people responsible for objectives, exceptions and operating quality. That transition requires deliberate redesign. Installing agents does not make it happen automatically.
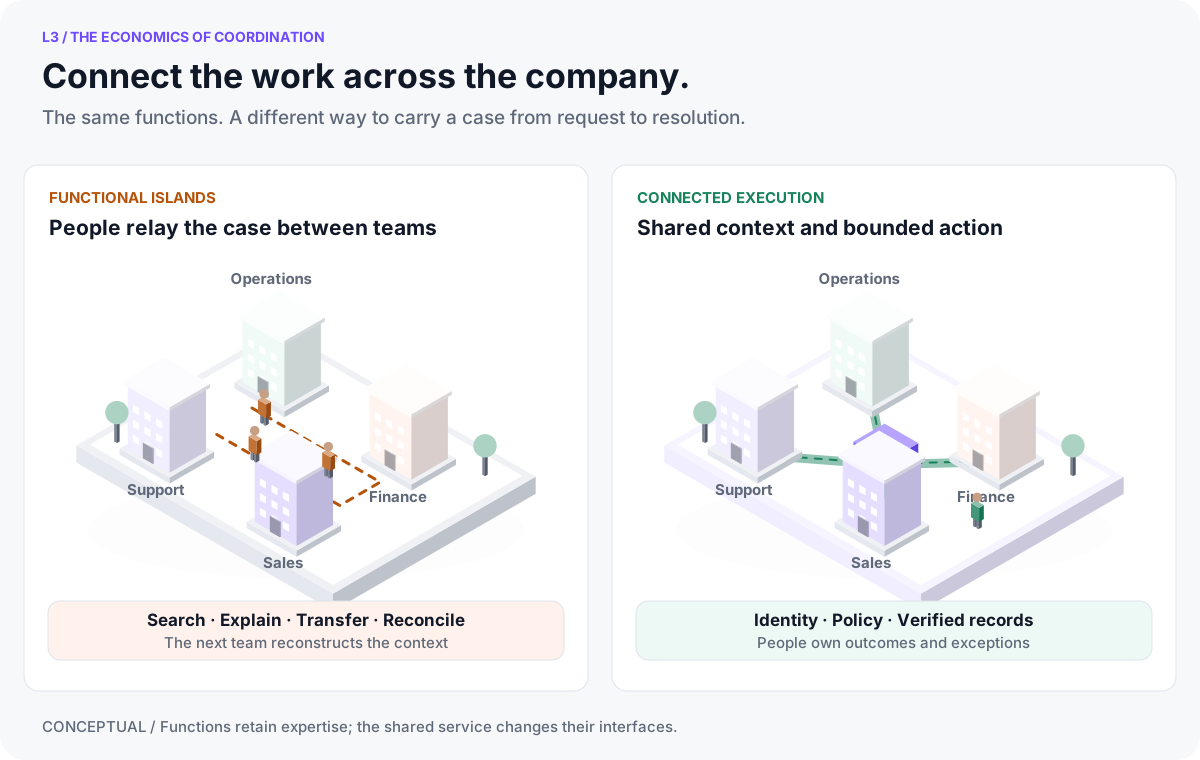
The economic unit is a completed outcome
Take a customer disputing a service charge. Resolving the case may require the original agreement, the billing record, proof of service, the applicable policy and an authorized correction. A useful result includes consistent records and an appropriate customer response.
The process consumes several kinds of resources. People perform the substantive task, search for evidence, translate it for another function, wait for a response, check what changed and recover from mistakes. Elapsed waiting time and active labor are different quantities. Both matter, but only active work belongs directly in a labor calculation.
| Coordination cost | What trusted cross-functional execution can remove | What the company still has to provide |
|---|---|---|
| Reconstructing context | Repeated searches and explanations of the same case | Reliable source records, common identifiers and freshness requirements |
| Relaying work | Copying evidence between inboxes, tickets and applications | Explicit ownership, routing rules and service commitments |
| Reconciling records | Manual comparison of updates made independently | Validation of the actual records and repair of partial failures |
| Routine approval | Repeated permission requests for actions already covered by policy | Enforced limits and review of consequential or ambiguous decisions |
| Coordination management | Chasing status and redistributing routine cases | Capacity planning, exception management and accountable leadership |
These costs can disappear from particular cases. Some also move into a shared platform that must be funded and maintained. The relevant comparison is total cost per correctly completed outcome, including the human effort and controls required to sustain it.
An agent that prepares a recommendation may create value before it has execution authority. Greater autonomy becomes economically useful where it removes a material bottleneck without introducing more review, recovery or loss than it saves.
What the research establishes
Evidence already shows that AI can improve task performance. It also shows why an individual productivity gain should not be treated as proof of organizational transformation.
| Research | Design and finding | Implication for this argument |
|---|---|---|
| Generative AI at Work | Staggered deployment across 5,172 customer support agents; 15% more issues resolved per hour on average. Human agents retained responsibility for conversations.1 | Assistance can increase service capacity. This study does not measure autonomous execution across an enterprise. |
| The Cybernetic Teammate | Preregistered field experiment with 776 P&G professionals on product innovation challenges. Individuals using AI matched the performance of teams without AI.2 | AI can supply some benefits of collaboration on the studied tasks. It does not establish that teams or specialist functions can generally be eliminated. |
| Shifting Work Patterns with Generative AI | The April 2025 research summary describes a six-month randomized experiment with approximately 6,000 workers. Tool users spent less time on email; time in meetings did not significantly change.3 | Work that an individual can change may respond before activities that require collective coordination. This is a concrete reason to redesign the process. |
These findings motivate the L3 question; they do not validate a universal L3 threshold. The levels are a diagnostic framework, and capabilities can differ between processes inside one company.
The economics of complementary investment also matters. Brynjolfsson, Rock and Syverson's productivity J-curve research explains how new processes, skills and other intangible investments can precede the measured payoff from a general-purpose technology.4 For enterprise AI, connecting records, defining authority and changing responsibilities are part of the investment. Their cost belongs in the business case.
What companies have actually implemented
The most useful public cases reveal the process boundary, the measured result and the remaining human role. They provide evidence of mechanisms relevant to L3, with different degrees of autonomy. They do not certify the maturity of an entire company.
| Company and operating process | Documented capability | Reported result and its scope |
|---|---|---|
| IBM, employee HR services | AskHR integrates with systems including Workday, SAP and Concur; routine service is paired with human advisors for complex needs. | IBM reports more than one million HR transactions in 2024, 94% containment of common questions, and a contribution to a 40% reduction in HR operational costs over four years.5 |
| Cisco, renewal preparation | The AI Renewals Agent combines structured and unstructured information from more than 50 signals and sources to prepare customer-specific proposals. | The February 2025 announcement estimated up to 20% less preparation time. This is a forecast for the scoped activity, rather than a measured company-wide cost reduction.6 |
| Dow, freight invoice analysis | One agent extracts emailed PDF invoice data and surfaces billing anomalies; employees use a second agent to investigate. | Microsoft's case describes more than 100,000 PDF shipping invoices annually and a proof of concept analyzing thousands. Global savings of millions were anticipated, rather than established by that report.7 |
| Klarna, customer service | A deployed AI assistant handles a large share of service chats alongside continued human support. | Its 2025 prospectus reports 69% of chats in the twelve months to June 2025 and approximately $39 million of cost savings in 2024, based on company estimates and operating data.8 |
IBM is particularly relevant to organizational design. Its case describes a two-tier service model and integration across HR applications. The multi-year cost result includes an evolving automation program; the agentic platform enhancement dates to 2025. Attributing the entire reduction to that enhancement would misread the evidence.
Cisco illustrates information assembly across many sources. Dow illustrates the connection between document processing and operational investigation while employees retain review. Klarna provides a financially material company estimate, with continued human service explicitly part of its approach. These are different operating designs, so their percentages should not be averaged into an expected return.
For a board, the next questions are specific: which work no longer required manual handling, how was completion established, what happened to exceptions, and how much of the released capacity became a financial or service benefit?
Why connected automation can have increasing returns
Consider three separately automated activities: investigate the complaint, determine the permitted remedy and update the relevant systems. Each can save time independently. Connecting them may also remove the handoffs between them. The value of the connection can therefore exceed the sum of the isolated task savings.
This is a complementarity argument. The company's second workflow may reuse identity, connectors, policy checks, operational context and monitoring built for the first. Reuse can lower its incremental delivery cost. A common case representation can also reduce the effort required when a process crosses into another function.
The returns depend on where the bottleneck sits. Automating many small tasks can leave every case waiting for one approver. Removing a smaller set of activities along the critical path can eliminate a queue. Additional automation eventually encounters harder cases, physical constraints and more expensive exceptions, so increasing returns should be demonstrated over a defined range.
The threshold is reached in a process when enough work completes reliably within delegated authority to justify a different allocation of people and responsibility. Financial break-even is one condition. The company must also have sufficient expert capacity for the remaining cases and a way to maintain service during disruption.
A transparent example of the threshold
Consider a service operation receiving 10,000 cases per month. The following figures are illustrative assumptions. They are separate from the company results above, and the calculation is reproducible from the downloadable inputs.
The baseline uses 20 human minutes per case. A team-level tool halves eight minutes of substantive task work to four, while leaving context reconstruction, handoff administration and checking unchanged. That produces 16 minutes of human work per case. This comparison isolates task improvement; it does not calculate the return on a separate L2 investment.
For the connected scenario, assume 70% of incoming cases achieve a verified outcome without human intervention during execution. The remaining 30% require 25 human minutes each, including investigation, approvals and recovery. An additional ten-minute audit of 5% of all incoming cases contributes an average 0.5 minutes per case. This is a modeled audit allowance; appropriate sampling depends on the process and consequences of failure.
| Human work per incoming case | Baseline | Team automation | Connected execution |
|---|---|---|---|
| Substantive task work | 8 min | 4 min | Included in exception work |
| Context reconstruction | 6 min | 6 min | Included in exception work |
| Handoff administration | 4 min | 4 min | Included in exception work |
| Validation and rework | 2 min | 2 min | Included in exception work |
| All human exception handling | Included above | Included above | 7.5 min |
| Additional sampled audit | Included in baseline | Included in baseline | 0.5 min |
| Total active human time | 20 min | 16 min | 8 min |
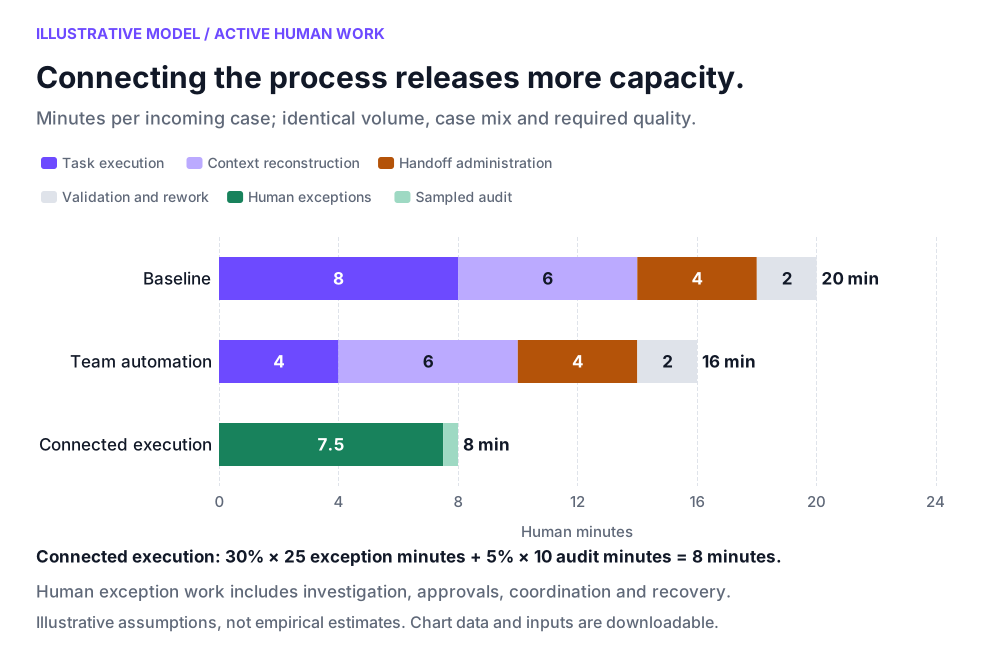
At a loaded labor rate of $60 per hour, baseline labor is $200,000 per month. The connected scenario uses $80,000 of human labor. Its monthly service allowance is $40,000: $30,000 of recurring operation and $10,000 of implementation amortization. Common existing IT costs are excluded from both sides.
| Monthly item | Baseline | Connected execution |
|---|---|---|
| Human labor | $200,000 | $80,000 |
| Incremental recurring service | — | $30,000 |
| Implementation amortization | — | $10,000 |
| Labor plus incremental service | $200,000 | $120,000 |
| Cost per case, assuming all achieve the required outcome | $20 | $12 |
The 2,000 released hours have a potential monthly capacity value of $120,000. After the service allowance, the modeled net benefit is $80,000 if all released capacity is put to productive use or converted into avoided expenditure. This is not evidence that the payroll will fall by $120,000.
If the company can use only half the released capacity, the modeled net value falls to $20,000. At one quarter, it is negative $10,000. Identifying the work that will absorb released capacity is therefore part of implementation.
| Released capacity used productively | Usable monthly value | Service allowance | Modeled net value |
|---|---|---|---|
| 25% | $30,000 | $40,000 | −$10,000 |
| 50% | $60,000 | $40,000 | $20,000 |
| 75% | $90,000 | $40,000 | $50,000 |
| 100% | $120,000 | $40,000 | $80,000 |
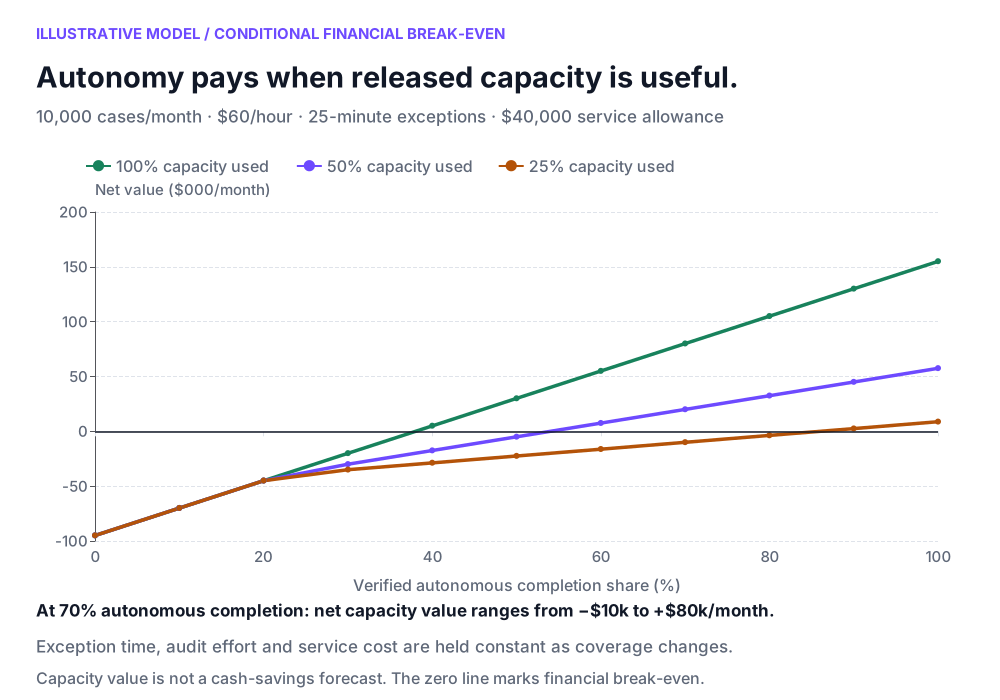
Under these assumptions, financial break-even occurs at 38% autonomous completion if all released capacity is useful, and 54% if only half is useful. The organizational redesign decision still depends on the distribution of exceptions, peak demand, service quality and the responsibilities that must remain staffed.
Failure costs can materially change the result. As a separate sensitivity, one additional $5,000 loss per 1,000 incoming cases adds $50,000 of expected monthly loss, reducing the headline $80,000 benefit to $30,000. The relevant input is the incremental loss relative to the existing process. A model score alone cannot supply it.
The $120,000 implementation cost also requires upfront funding. Twelve-month amortization is an economic allowance; a cash payback calculation requires actual timing of expenditure and realized cash benefits.
Validate the outcome and the economics
A completed tool call establishes that a request was made. A credible service must establish that the intended business change occurred and remained correct.
For the billing complaint, the evidence should connect the incoming case, source records, applicable policy, authorized action, changed records and customer response. Duplicate writes, partial updates and later reversals must be visible. Completion can include a time window: a case reopened because the correction failed should count against the original success claim.
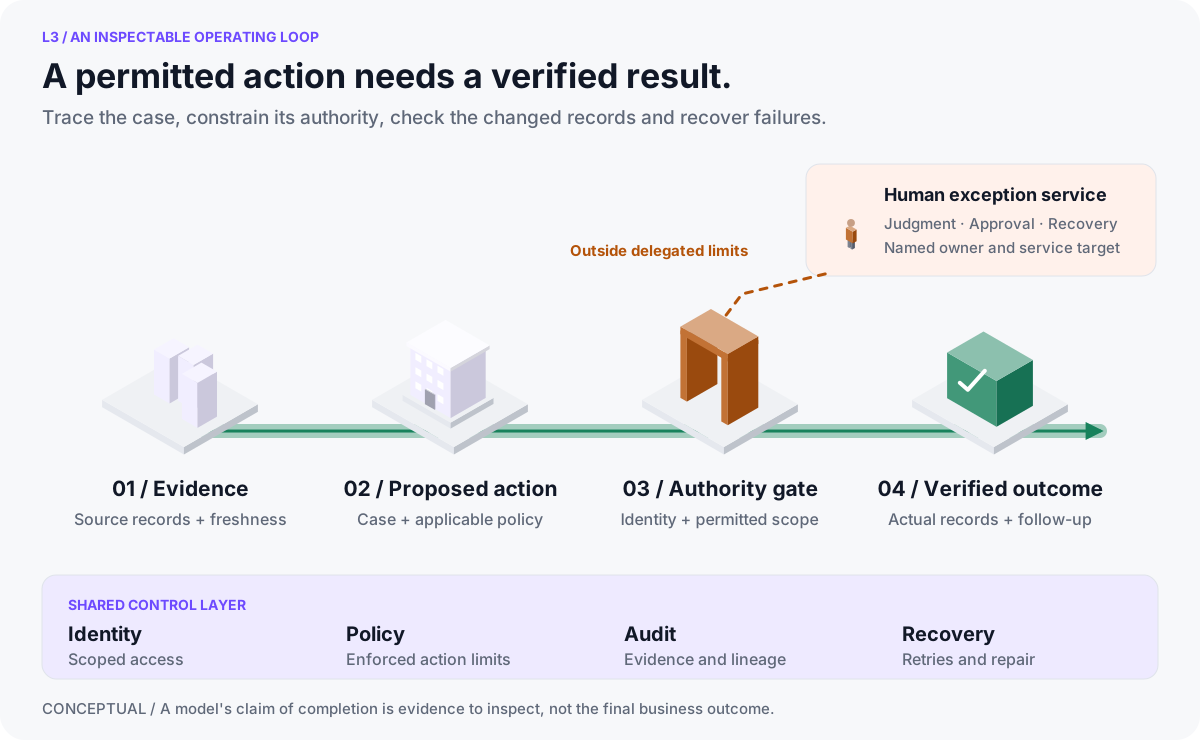
I would instrument the following measures before changing staffing or delegation:
| Measure | Definition and decision it supports |
|---|---|
| Verified completion | Intended outcomes achieved, including subsequent reversals or reopened cases within a defined window |
| Autonomous completion share | Verified cases without intervention during execution, divided by a defined eligible population; also disclose the share of all incoming work |
| Human effort | Investigation, approval, quality review, correction, coordination and recovery minutes per incoming case |
| Total cost per verified outcome | Labor, service operation, amortized implementation and incremental failure loss, divided by verified completions |
| End-to-end service time | Median and slow-case resolution time, backlog age and time spent waiting for people or systems |
| Exception demand | Volume, severity, expert handling time and arrival peaks, including appropriate escalations |
| Business result | Customer experience, revenue retention, actual spending avoided or reduced, and useful work performed with released capacity |
Compare the new service with a credible baseline at comparable volume, case mix and quality. Randomized routing is useful where practical; otherwise, use a phased rollout and explicitly account for differences in the work. Keep easy cases and difficult cases visible separately. A high success rate on a narrow accepted subset can conceal low enterprise coverage.
Use deterministic checks for record consistency, calibrated AI assessment for suitable judgments, and independent domain review for consequential outcomes. Retain expert corrections, expert-AI disagreements and subsequent outcomes as evidence for future delegation decisions. NIST's AI Risk Management Framework similarly calls for deployment-relevant assessment, independent review and ongoing monitoring.9
The service owner must be able to pause a failing workflow and recover unfinished cases. Shared infrastructure can reduce duplication while allowing one defective connector or policy to affect many processes; release controls and recovery capacity are part of its economics.
Restructure work around outcome ownership
The operating model should follow the demonstrated capability. Start with a bounded process that has an identifiable customer, a measurable result and a responsible owner. Connect its information and permitted actions, observe its exception load, then change roles and handoffs based on that evidence.
| Responsibility today | Responsibility after connected execution is established |
|---|---|
| Employees repeatedly gather and relay case information | Domain teams maintain authoritative context and resolve ambiguity |
| A queue owner routes each routine case | A service owner manages end-to-end quality, throughput and exception capacity |
| Managers approve a large volume of predictable actions | Business owners define delegation rules and retain consequential decisions |
| Technical teams build separate integrations for each use case | A shared platform supplies maintained connectors, identity, validation and observability |
| Reporting teams assemble recurring status updates | Analysts investigate deviations, test explanations and support interventions |
Functional expertise remains essential. Finance owns accounting standards, HR owns employment practices and operations owns delivery knowledge. A process owner needs enough authority to resolve conflicts across these functions without leaving the same coordination problem under a new title.
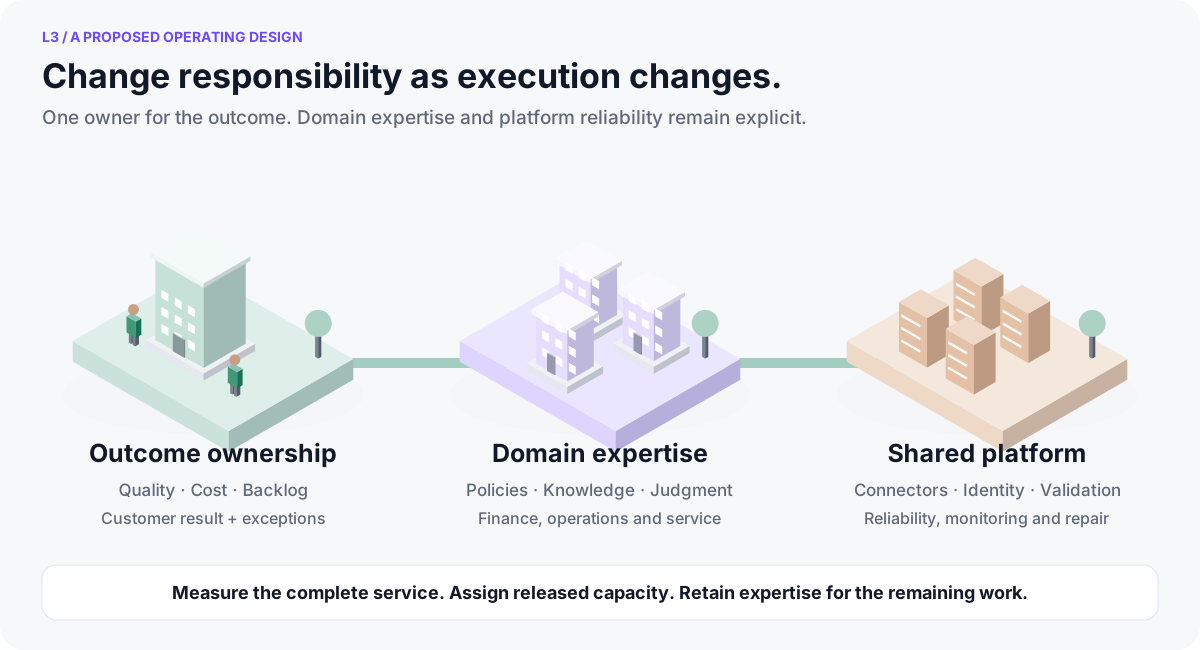
Business and product owners should define the intended outcome, acceptable tradeoffs and delegation boundaries. Engineering should provide the controls that enforce them. Domain specialists should be able to contribute reusable skills through supported templates, tests and releases, with explicit maintenance ownership.
Use predictable workflows for repeatable cases. Use agentic investigation where the next step depends on new evidence. Consequential decisions can retain expert accountability with AI providing a second opinion. This keeps the method matched to the work rather than forcing every process into the same agent architecture.
Human capacity requires particular care. The remaining exceptions may be harder and less predictable than the original average case. Plan around their handling time, severity and arrival peaks. Maintain supervised practice and training so that the organization continues producing the expertise on which its exception service depends.
Change incentives as well as roles. A department rewarded only for clearing its own queue can transfer incomplete work downstream. An end-to-end owner should see final quality, total cost, customer outcomes and unresolved work. Released capacity needs an explicit destination: additional demand, improved service, backlog reduction or avoided hiring, with the benefit verified afterward.
What an L3 company looks like
I would recognize the transition through a portfolio of operating services. Material workflows share reliable context, act under defined identities and permissions, and have owners accountable for verified outcomes. Employees can inspect why a case moved, what changed and where an exception belongs.
The company can disclose which processes operate this way, their share of business volume and their measured economics. It can also explain which activities retain direct human judgment. One excellent workflow establishes a capability; broad, sustained coverage establishes an organizational operating model.
The practical test is whether coordination has changed. Which searches, status requests, reconciliations and routine approvals have disappeared? Which new platform and assurance costs replaced them? What useful work became possible with the capacity released? Those answers should explain the organizational changes management chooses to make.
Where to go from here
L4 adds a maintained improvement loop: operational outcomes expose a weakness, a candidate change is evaluated, and an authorized release improves subsequent work. Google DeepMind's AlphaEvolve demonstrates automated algorithm improvement with deployed benefits; the Harness² paper explores recursive harness improvement in benchmark settings.1011
These are useful directions once connected execution is dependable. Retaining human approval for releases is compatible with an L4 loop. The requirement is evidence that a persistent change improves later outcomes without unacceptable regressions, after the cost of optimization and review. For a company building toward L3, the immediate economic task is to establish reliable execution across boundaries and redesign the work that surrounds it.
References and supporting data
Research findings, company-reported results and illustrative assumptions are identified separately throughout. Company cases support the described capabilities and reported metrics; they are not independent causal estimates of the benefit of reaching L3. Sources were reviewed on 21 October 2026. The work-patterns discussion uses the explicitly identified April 2025 summary.
Download the scenario assumptions, calculated results, sensitivity table as CSV, and source register. The calculation and diagram generator reproduces the arithmetic and the three isometric illustrations; the repository build also renders the two charts with pinned Apache ECharts. Reusable human-work chart options and sensitivity chart options are available.
-
Erik Brynjolfsson, Danielle Li and Lindsey Raymond. Generative AI at Work. Quarterly Journal of Economics, 140(2), 2025, pp. 889–942. The published study reports 5,172 agents and a 15% average productivity increase; earlier working-paper figures differ. ↩
-
Fabrizio Dell'Acqua and colleagues. The Cybernetic Teammate: A Field Experiment on Generative AI Reshaping Teamwork and Expertise. NBER Working Paper 33641, 2025. The cited experiment concerns bounded product innovation challenges at P&G. ↩
-
Eleanor Dillon, Sonia Jaffe, Nicole Immorlica and Christopher Stanton. Shifting Work Patterns with Generative AI. April 2025 research summary. Its approximately 6,000-worker sample and six-month period identify the version used here; the NBER paper has subsequent revisions. ↩
-
Erik Brynjolfsson, Daniel Rock and Chad Syverson. The Productivity J-Curve: How Intangibles Complement General Purpose Technologies. NBER Working Paper 25148, 2018, revised 2020. ↩
-
IBM. IBM AskHR. Company case study. The four-year HR cost result reflects a broader evolving program; watsonx Orchestrate integration is dated 2025. ↩
-
Cisco. Cisco and Mistral AI Partner to Deliver on Cisco's Mission to Transform the Customer Experience with AI. 10 February 2025. The preparation-time reduction is an estimate in the announcement. ↩
-
Microsoft WorkLab. AI impact at Dow: Copilot identifies millions in cost savings. Vendor-published customer case describing a proof of concept and anticipated global savings. ↩
-
Klarna Group plc. 2025 prospectus, Form 424B4. The filing distinguishes the twelve months to June 2025 chat share from the estimated 2024 cost savings and describes continued high-quality human support. ↩
-
NIST. AI Risk Management Framework 1.0, Core. In particular MEASURE 1.3, 2.3 and 2.4 on independent assessment, deployment conditions and production monitoring. ↩
-
Google DeepMind. AlphaEvolve: A Gemini-powered coding agent for designing advanced algorithms. 14 May 2025. Describes automated evaluation and algorithms deployed in Google's computing infrastructure. ↩
-
Ruiyao Xu and colleagues. Harness²: Recursive Agent Harnessing for an Open World. arXiv:2610.14224v1, 9 October 2026. Benchmark research with frozen model parameters, rather than evidence of company-wide L4 operations. ↩